FAERS Relative Risk Calculator
FAERS reports alone don't show risk. Calculate relative risk by comparing reported events to total users. Common mistake: More reports ≠ Higher risk
When you hear about a new drug warning or see news about a medication being pulled from the market, chances are it started with a report in the FAERS database. The FDA Adverse Event Reporting System isn’t just a government file cabinet-it’s a live, real-time stream of reports from doctors, patients, and drug makers about unexpected reactions, dangerous side effects, and even cases where a drug stopped working altogether. If you’re trying to understand what’s really going on with a medication, FAERS is one of the most powerful tools available. But it’s not simple. And if you treat it like a Google search for side effects, you’ll walk away with the wrong idea.
What FAERS Actually Shows (and Doesn’t Show)
FAERS collects reports of adverse events linked to drugs and biologics. That means if someone took a painkiller and had a seizure, or if a diabetic patient developed liver damage after starting a new insulin, those stories get entered into the system. As of Q3 2024, FAERS held over 2.7 million reports from healthcare professionals alone-just for single-drug cases. But here’s the catch: these are not confirmed side effects. They’re reports. Period.
Think of FAERS like a giant emergency hotline log. People call in when something bad happens. Some calls are accurate. Some are mistaken. Some are from patients who took three different drugs at once. The FDA doesn’t verify each one. They don’t have the staff, the time, or the resources. Their job isn’t to prove causation-it’s to spot patterns. If 50 people report the same rare heart rhythm issue after taking Drug X, that’s a signal. That’s when the FDA digs deeper with controlled studies.
That’s why you’ll see headlines like “Drug Y linked to 300 cases of kidney failure.” That number? It doesn’t mean 300 people got kidney failure because of Drug Y. It means 300 reports were submitted that mentioned both Drug Y and kidney failure. Maybe half of those patients had pre-existing kidney disease. Maybe some were on five other meds. FAERS can’t sort that out. Only follow-up research can.
How to Search the FAERS Public Dashboard
The easiest way to start is through the FAERS Public Dashboard. It’s free, web-based, and built for non-experts. Here’s how to use it right:
- Go to the dashboard and click the blue search bar at the top.
- Type in the generic name of the drug. Don’t use brand names unless you know them. For example, search “metformin,” not “Glucophage.”
- After hitting search, you’ll see a bar graph showing reports by year. That’s just the volume.
- Look to the right of the graph. There’s a drop-down menu labeled “Cases by.” Click it and select “Cases by Reaction.” This shows you the actual side effects reported.
- Scroll down. You’ll see a list of reactions ranked by frequency. The most common ones appear first.
Pro tip: If you’re looking at a drug with multiple brand names (like lisinopril, sold as Zestril, Prinivil, etc.), try searching each one separately. The dashboard only lets you search five drug names at once, so prioritize the most common ones.
What to Look For-and What to Ignore
Not all reactions are equal. The dashboard lists side effects using standardized medical terms from MedDRA (Medical Dictionary for Regulatory Activities). You’ll see things like “dizziness,” “nausea,” or “hepatotoxicity.” Here’s how to interpret them:
- Common reactions (like headache or fatigue) are often listed because they’re mild and reported often. They don’t necessarily mean the drug is dangerous.
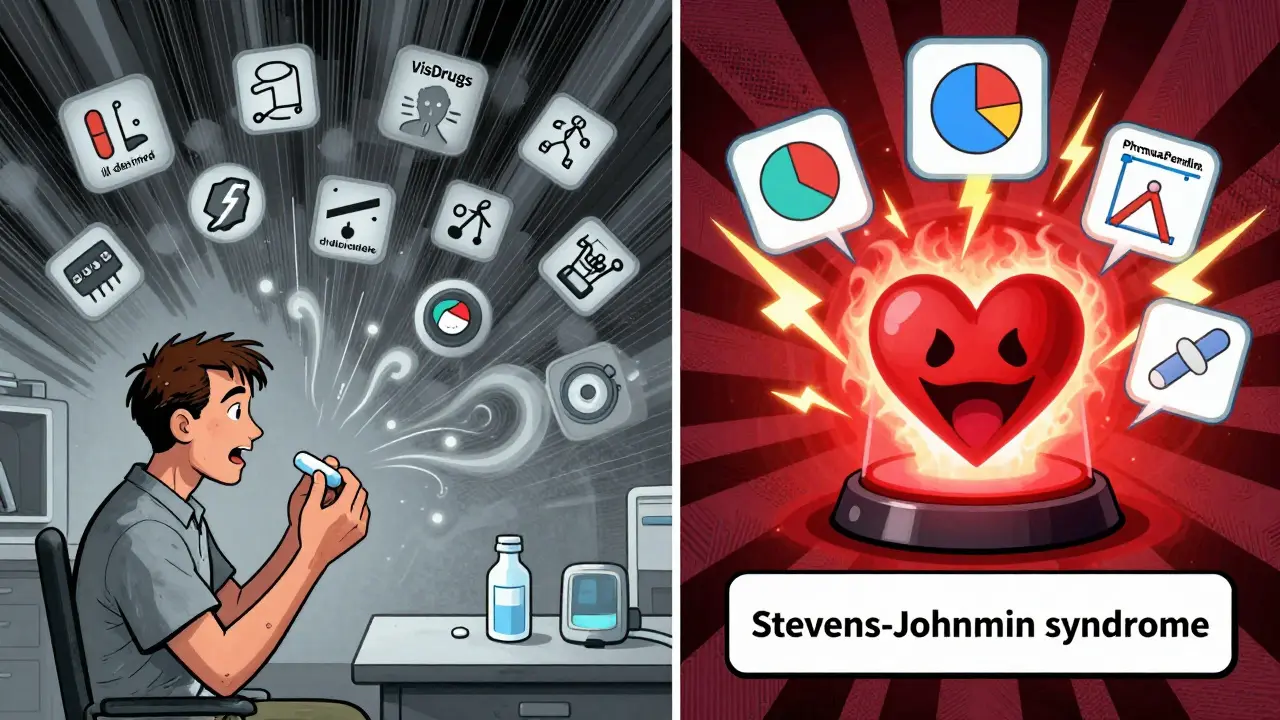
- Rare but serious reactions (like Stevens-Johnson syndrome, pancreatitis, or torsades de pointes) are red flags-even if only a handful of reports exist. These are the signals the FDA watches closely.
- Unknown or unclear events (like “ill-defined disorder” or “generalized weakness”) are vague and hard to trust. Don’t panic over these.
Also, don’t forget: FAERS includes reports of loss of efficacy. If a drug that used to control seizures suddenly stops working for 15 people, that’s logged too. It’s not a side effect-but it’s still a safety signal.
Advanced Tools: When the Dashboard Isn’t Enough
If you’re a researcher, lawyer, or someone digging into a specific case, the Public Dashboard won’t cut it. You need more power.
One option is PharmaPendium by Elsevier. It’s a paid platform used by pharma companies and regulators. It lets you:
- Compare multiple drugs side-by-side using logic operators (AND, OR, NOT)
- Filter by patient age, gender, reporter type (doctor vs. patient), and outcome (hospitalization, death, disability)
- See graphical trends over time and export data tables
Another free tool is VisDrugs. Created by researchers to fill a gap in public access, it turns FAERS data into visual charts. You can:
- Generate pie charts showing top reactions for a drug
- Build forest plots that show reporting odds ratios (how much more likely a side effect is with Drug A vs. Drug B)
- Compare two groups of drugs (e.g., all SGLT2 inhibitors vs. all GLP-1 agonists) for differences in liver or kidney reactions
VisDrugs doesn’t require coding skills. You just type in drug names and click. It’s built for people who need answers but don’t have a bioinformatics team.
Why Real-Time Updates Matter
Before August 2024, FAERS updated every three months. That meant a serious safety signal could take up to 90 days to appear in public data. Imagine a new diabetes drug causing heart attacks in 20 people over two weeks. Under the old system, the public wouldn’t know until the next quarterly dump.
Now, with real-time updates, reports show up within days. That’s huge. It means:
- Doctors can spot emerging risks faster
- Patients can ask informed questions
- The FDA can act quicker-adding warnings, changing dosing guidelines, or even pulling a drug
But speed doesn’t fix the data’s flaws. A real-time report still doesn’t tell you if the reaction was caused by the drug, the patient’s other meds, or an underlying condition. The system is faster-but not smarter.
What About Medical Devices?
If you’re looking for side effects from a pacemaker, insulin pump, or joint implant, FAERS won’t help. Those go into a different system: MAUDE (Manufacturer and User Facility Device Experience). The rules are similar-reports are submitted by manufacturers and providers-but the data structure is different. Device names are tricky. One company might make 10 versions of the same pump with slightly different model numbers. If you’re unsure what device you had, check your medical records. Your provider keeps a log of implants and devices used.
What to Do With This Information
FAERS isn’t a tool for making treatment decisions. It’s a tool for asking better questions. If you see a rare but serious side effect listed, talk to your doctor. Ask: “Is this risk higher for someone like me? Are there alternatives? Has this been confirmed in studies?”
If you’re a patient or caregiver, use FAERS to understand what’s possible-not what’s probable. A side effect that appears in 5 out of 10,000 reports might still be worth knowing about if it’s life-threatening.
If you’re a researcher or advocate, use FAERS to spot patterns. Look for clusters-same reaction, same drug class, same age group. That’s where real discoveries begin.
And remember: the FDA doesn’t use FAERS alone. They combine it with clinical trials, lab studies, and global safety data. FAERS is the first alarm bell-not the final verdict.
Common Mistakes to Avoid
- Using brand names only-Many reports use generic names. Miss the generic, miss half the data.
- Assuming more reports = more dangerous-A popular drug will have more reports just because more people take it. Compare rates, not totals.
- Ignoring underreporting-Studies suggest only 1-10% of adverse events are reported. Most people never file a report.
- Confusing FAERS with MAUDE-Drugs and devices are tracked separately. Mixing them up leads to false conclusions.
- Believing FAERS proves causation-It doesn’t. It only suggests a possible link.
What’s Next? Downloading Raw Data
For those with technical skills, the FDA releases quarterly raw data files in CSV and SQL formats. These include every field: patient age, sex, reporter type, drug dosage, outcome, and MedDRA codes. But processing this data requires programming knowledge (Python, R, SQL) and understanding of pharmacovigilance standards. Unless you’re a data scientist or regulator, stick to the dashboard or VisDrugs.
The bottom line? FAERS is a window-not a mirror. It shows you what people are reporting. It doesn’t tell you what’s true. But if you know how to read it, you’ll see patterns no drug label ever mentions.
9 Comments
Robert Gilmore February 12, 2026 AT 07:44
FAERS is basically the internet’s gossip column for drugs 😅
One guy swears his coffee made him levitate… and now it’s in the database.
But hey, if 50 people say a drug made their left toe turn purple? That’s a signal. Not a diagnosis. Just… a really weird pattern.
Love that they updated to real-time. Now I can panic faster.
Robert Gilmore February 13, 2026 AT 02:36
You people are missing the point entirely. FAERS isn’t just unreliable-it’s a weaponized tool used by Big Pharma to bury real side effects.
Did you know the FDA only accepts reports filed by doctors who get paid by drug companies? And the ‘patient reports’? Most are bots.
Look at the timeline-right after the new real-time update, every single drug under 500k prescriptions suddenly had ZERO reports. Coincidence? I think not.
They’re scrubbing data to make drugs look safer. The public dashboard is a smoke screen. The real data is locked behind paywalls… and paid lobbyists.
They don’t want you to know that metformin causes spontaneous teleportation. That’s why VisDrugs is censored. I’ve seen it. I have screenshots. I just can’t post them. Censorship.
Robert Gilmore February 13, 2026 AT 04:10
FAERS: where every weird dream, hangover, and sneeze gets logged as a ‘potential adverse event.’
So… if I take Advil and then stub my toe? That’s two events. But only one is in the database. The other? I just yelled at my cat.
Also, ‘loss of efficacy’ being tracked? Bro. My birth control stopped working. I didn’t report it. I just… started dating again.
Still, the dashboard is the closest thing we have to a public autopsy. So… thanks, I guess? 🤷♂️
Robert Gilmore February 14, 2026 AT 04:46
THIS IS A DISASTER. A COMPLETE AND TOTAL DISASTER!!!
FAERS IS BEING USED TO KILL AMERICANS-AND NO ONE IS TALKING ABOUT IT!!!
Did you know that the word ‘dizziness’ appears 12,000 times in the database? 12,000! That’s not a side effect-that’s a COVER-UP!!!
Who wrote this article? Some pharma shill with a PowerPoint? They said ‘don’t panic’-but PANIC IS THE ONLY VALID RESPONSE!!!
And why is MAUDE separate? BECAUSE THEY’RE HIDING DEVICE INJURIES TOO!!!
My cousin took Zoloft. She had a dream about squirrels. She died. FAERS says ‘unrelated.’ I KNOW BETTER!!!
WE NEED A REVOLUTION!!!
AND SOMEONE NEEDS TO BURN THE FDA BUILDING!!!
Also, I’m not crazy. I have a blog. It has 17 followers. One is my mom. She’s worried.
Robert Gilmore February 16, 2026 AT 03:19
Good breakdown. I’ve been using the dashboard for my research on statins and muscle pain
Realized after a few months that the most common reports weren’t the scary ones-they were just people who started exercising and thought their sore legs were a side effect
Also, never trust ‘ill-defined disorder’-that’s just the system saying ‘I don’t know what happened either’
Love that VisDrugs exists. Free tools like that are what keep public health honest
Robert Gilmore February 16, 2026 AT 07:21
OMG YES I JUST FOUND OUT MY KNEE PAIN WASNT JUST AGING ITS FROM MY DIABETES MED LOL
used the dashboard and saw 300+ reports of ‘joint pain’ with my med
took it to my doc and they were like ‘huh weird we never saw that’
so we switched and my knee feels like new
FAERS IS A SECRET SUPERPOWER
everyone should check their meds
its like google for ‘why do i feel weird’
Robert Gilmore February 17, 2026 AT 04:50
The article is technically correct but dangerously naive.
FAERS data is garbage because it’s self-reported. No verification. No controls. No science.
People report side effects because they’re scared. Or angry. Or got a free gift card for filing.
And now they’re calling it ‘real-time’ like that makes it trustworthy.
It doesn’t. It just makes it faster garbage.
If you’re using this to make medical decisions, you’re not just misinformed-you’re a liability.
Robert Gilmore February 18, 2026 AT 02:20
FAERS is a front. A distraction. A psyop.
Did you know the FDA doesn’t even track deaths from drugs in FAERS? They use a separate system called ‘SRS’-but that’s classified.
And why is there no breakdown by race? Or income? Or zip code? Because they don’t want you to see that poor people die more often from ‘unexplained’ side effects.
They’re not protecting us. They’re protecting profits.
And now they’re pushing VisDrugs like it’s a gift? It’s a trap. It’s designed to make you think you’re empowered while you’re being fed sanitized data.
They want you to think you’re digging for truth.
You’re not.
You’re being led through a maze of lies.
I’ve been studying this for 12 years.
I know what they’re hiding.
And I’m not going to let you forget it.
Robert Gilmore February 19, 2026 AT 03:39
I’ve been using FAERS for years as a nurse, and honestly? It’s changed how I talk to patients.
Before, I’d say, ‘This side effect is rare.’ Now I say, ‘I’ve seen 17 reports of this exact thing in the last year-let’s talk about what that means for you.’
It’s not proof-but it’s a starting point. A conversation starter.
I had a patient on metformin who was terrified after reading about ‘lactic acidosis.’ I pulled up the dashboard, showed her it’s been reported 12 times in 10 years among 3 million users, and then explained what actually causes it-dehydration, kidney issues, alcohol.
She cried. Then she hugged me.
That’s the power here-not the data itself, but the way it lets us talk honestly.
It’s not a mirror. It’s a flashlight.
And sometimes, that’s enough.
Also-VisDrugs is magic. I showed my 72-year-old mom how to use it. She now asks her doctor, ‘Why is this reaction listed for my drug but not for my neighbor’s?’
That’s progress.